
Patent Vault is being upgraded with powerful features like the Patent Matrix, which delivers effective new ways to calculate and categorize patent data to better prepare a patent analysis report.
When it comes to patent data, basic statistical charts do have their place, especially when it comes to the calculation of one dimension of the data.
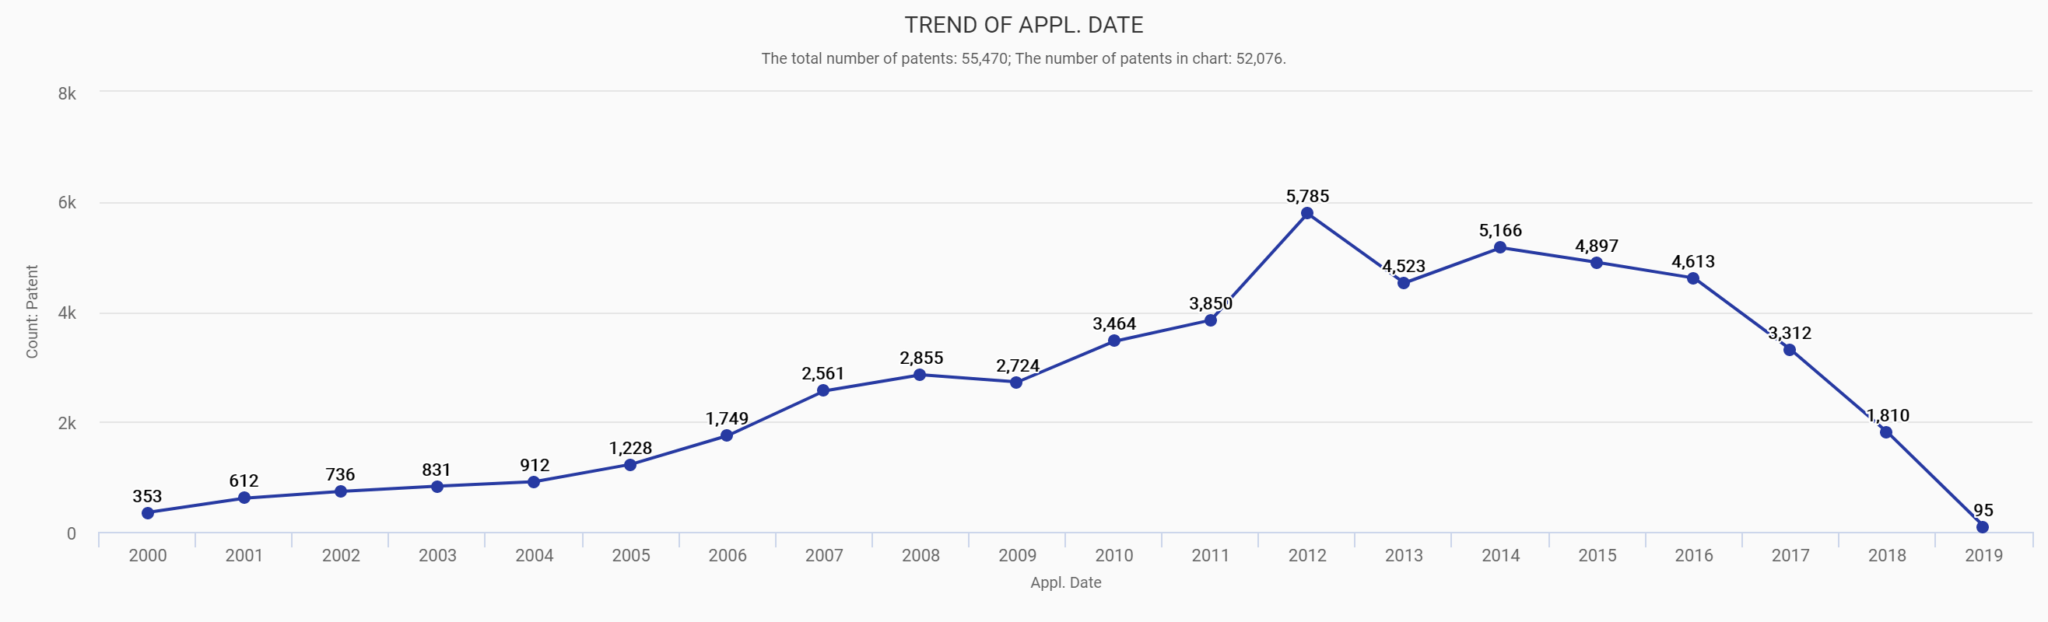
A basic statistical chart in Patentcloud showing the application trend at Apple
However, when it comes to categorizing by product, industry, or technology, basic charts often fall short of the task. This is where a pivot table comes into play.
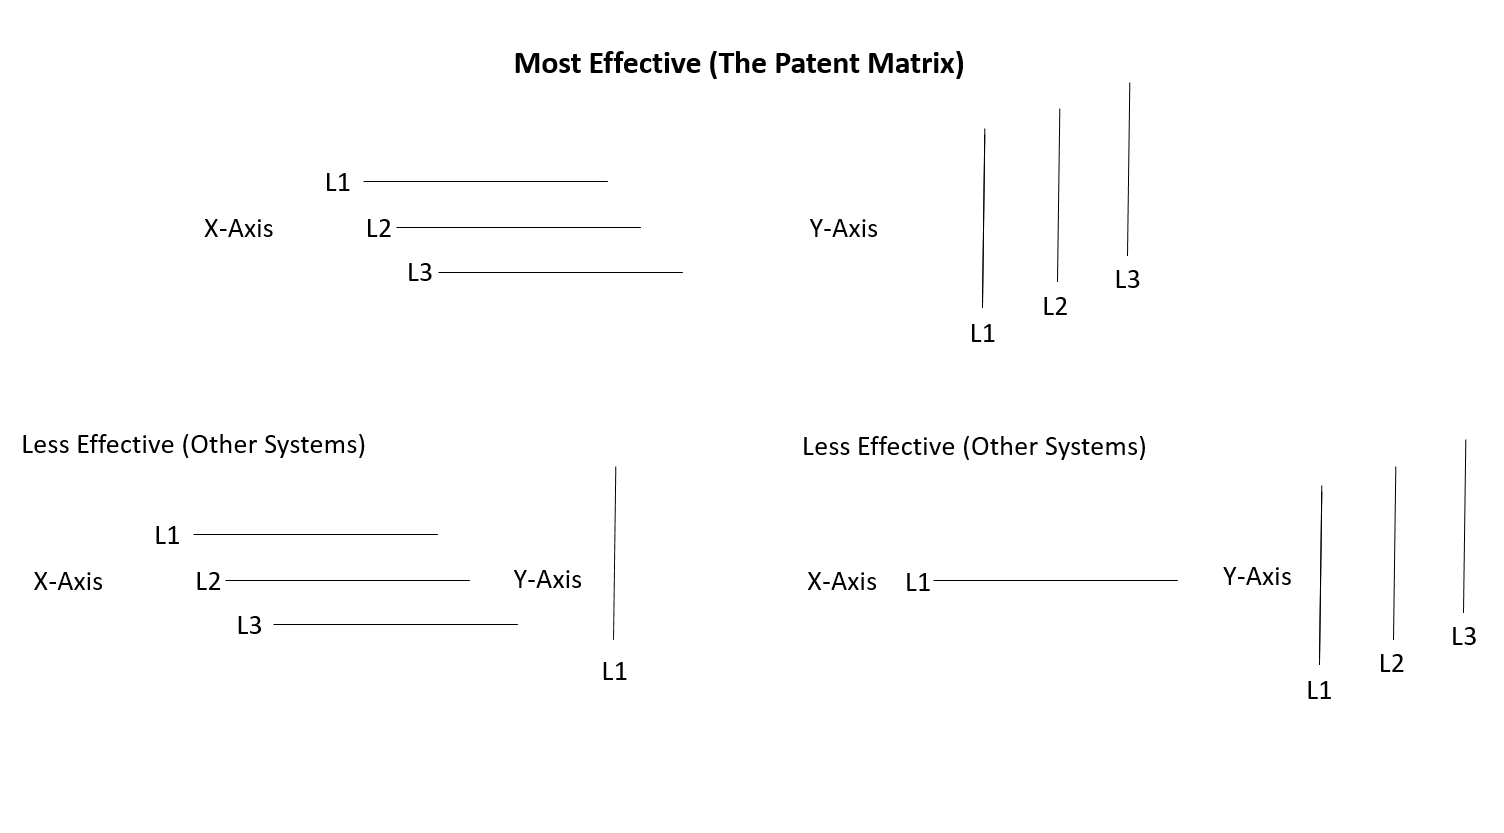
But not just any pivot table will do. What is actually needed is a Patent Matrix, with the robust capabilities to handle a wide range of data and several types of categories.
More Powerful Than a Pivot Table
Completely Customizable Patent Analytsis Report Data
To make an effective patent analysis report a reality, a Patent Matrix is needed. This Matrix allows certain data aspects, such as product or technology, to be visualized clearly by integrating them into a pivot table that represents patent data in a hierarchical way.
The key, however, is to make the data or fields in the Patent Matrix completely customizable by the user. Ease of use is important. Instead of forcing users to attempt to do this on their own, as was necessary in the past, this customization of the data should be incorporated right into the Matrix and achievable in just a few clicks.
Hierarchical Processing in Combination
By utilizing hierarchical processing, such as a tree structure, patent data can be organized by product or technology, for example.
This information on its own, however, doesn’t provide much meaning. It is only when this data is combined with another data set that it starts to provide insights through a patent analysis report.
Take a topic like an “unmanned vehicle.” On its own, this data will not tell you much. However, when it presented in combination with other data, such as Current Assignee or Legal Status, this is when it becomes possible to gain insights into who is involved in certain technologies or who is holding or developing patents in certain fields.
Benefits of the Patent Matrix- The patent analysis report
With such a Patent analysis report, a wide range of benefits has been unlocked for users, such as:
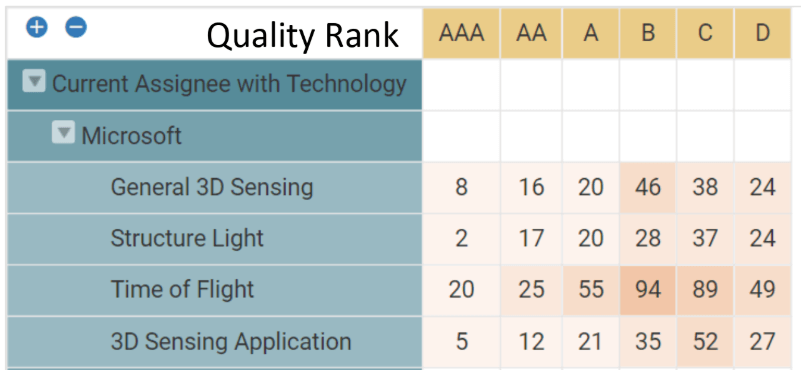
1. Overview of Patent Quality and Value
Gain a better understanding of the quality and value of a competitor’s specific patents — or your own — with a comprehensive overview, organized in a clearly visualized table.
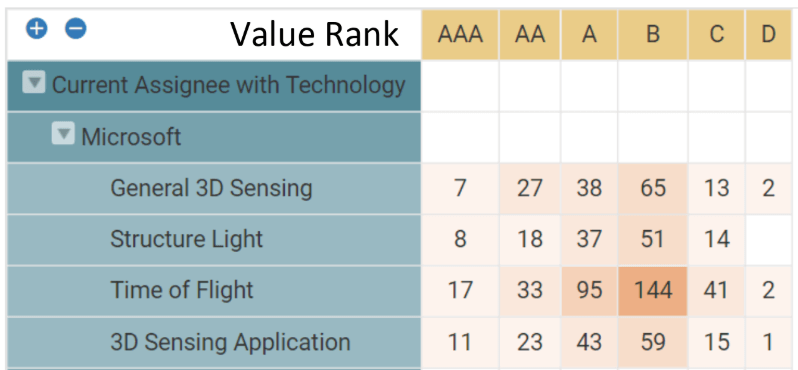
2. Overview of a Company’s Patent Activities
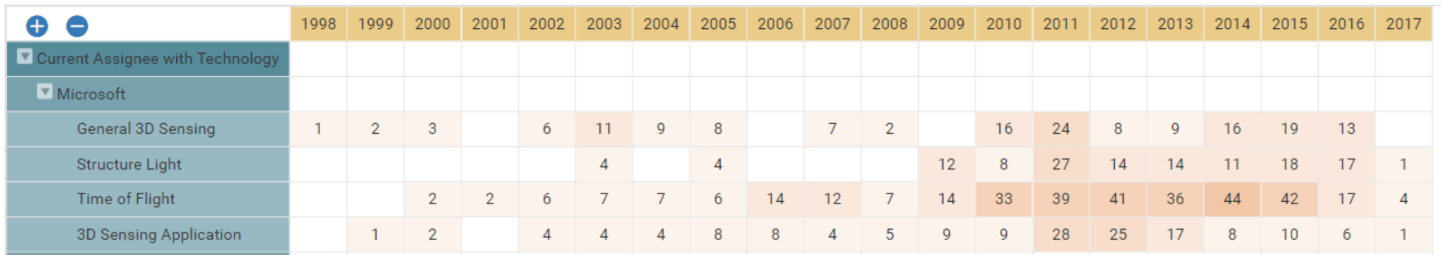
By correlating different data fields, such as technical structure and application year, it is possible to visualize the patent activity of a specific company, such as Microsoft, and glean insights into that company’s business strategy.
3. Comparison of Patent Applicants and Owners
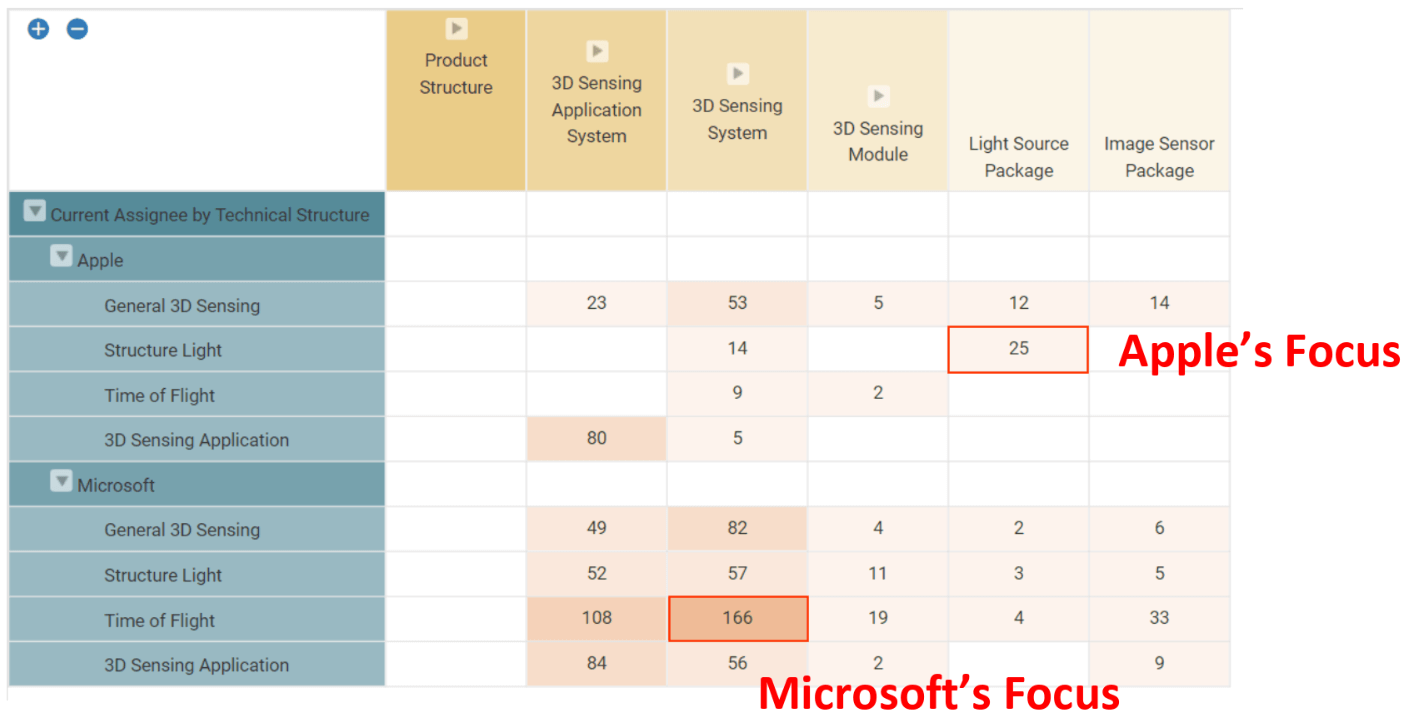
Understand who owns patents and who is applying for them in certain fields by comparing the patent activity of two or more companies, to gain a better understanding of that technology and the players involved in that field.
The above are just a few examples of how the Patent Matrix can be utilized, and since the data is completely customizable, it is easy to iterate and compare different data combinations, such as technology and product.
In the next part of this article, we will take a closer look at some of the practical uses of the Patent Matrix and form an informative patent analysis report.