
COVID-19
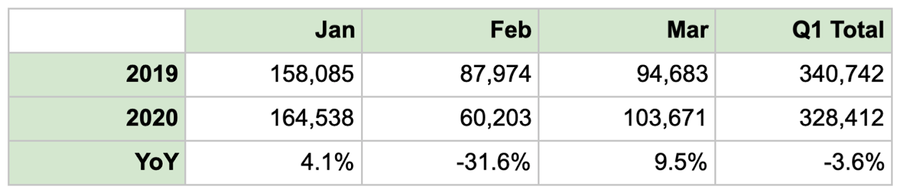
As we reported earlier, the COVID-19 pandemic has already affected China’s patent landscape. According to the CNIPA, patent filings for February 2020 decreased by 31.6%, bringing the overall figure for Q1 to -3.6%.
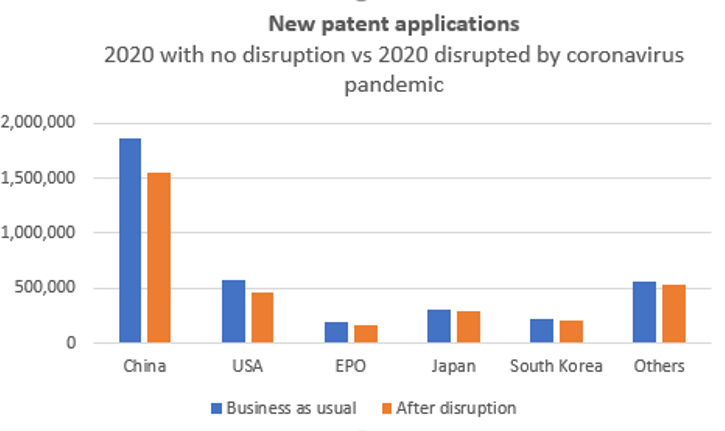
China’s numbers reflect a global trend that is set to affect any patent office. What happened in China — which was forced to close down to curb the outbreak — happened in Europe and in the US as well. With Latin America, Africa, and India emerging as new hotspots, similar numbers are expected.
Some models predict that this year patent applications will fall by more than 10% and by as much as 20%.
Predictions aside, the only way to assess the impact of COVID-19 on the patent world is to compare last year’s figures with this year’s when they become available. For ease of comparison, we collected and analyzed the data from 2019 to provide a comprehensive snapshot of the pre-COVID situation.
The data was collected from various sources (CNIPA, NCAC, and SPC) and analyzed using Patentcloud, our cloud-based IP intelligence platform. Without further ado, below are our key takeaways from the Chinese IP landscape of 2019.
1. The growth of patent filings is slowing down
Utility models — once again — drove the most growth.
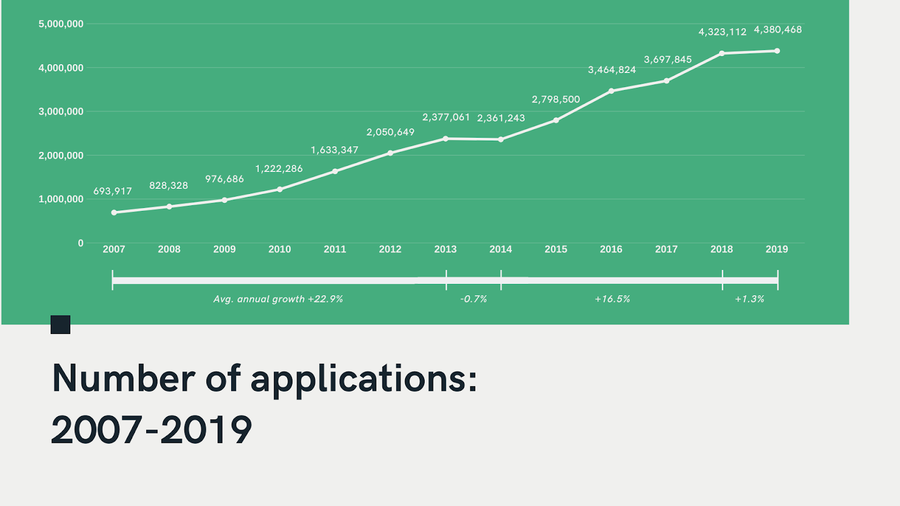
Combining the number of inventions, utility models, and designs, 4.38 million patent applications were filed in China last year. Compared with the average growth rates of 22.9% between 2007 and 2013 and 16.5% between 2014 and 2018, the 1.3% growth rate between 2018 and 2019 shows a significant slowdown.
By digging further into the data, we noticed that the number of invention patent filings experienced a decrease of 9.2%, while utility patents experienced growth of 9.5% (bringing the total share to 51.8%, the highest percentage on record). This seems to confirm the great importance that this form of IP protection still has in China, as we discussed before in detail.
Of the total number of 4.38 million patent applications, 95.8% were filed by domestic entities, while 4.2% were filed by foreign entities.
2. China dominated PCT patent applications
The Asian country surpassed the US, becoming the first worldwide.
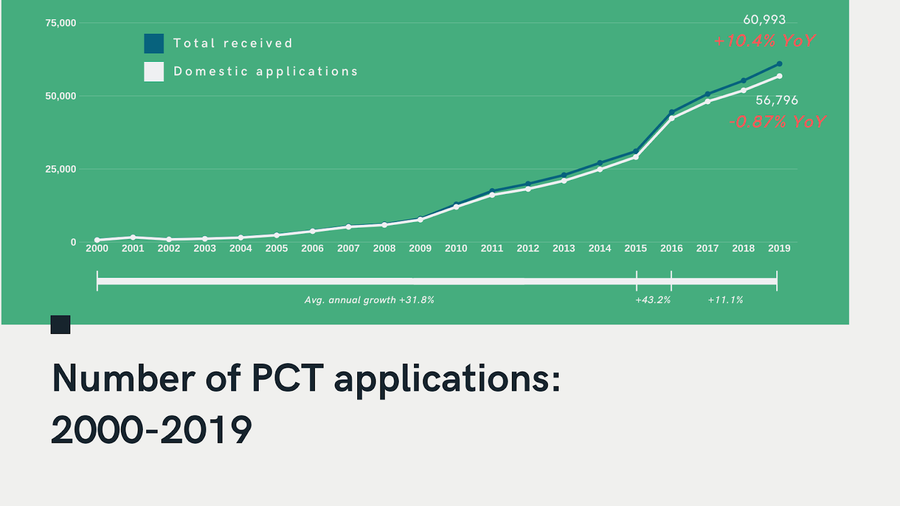
About 61,000 PCT patent applications were filed in 2019, an annual growth rate of 10.4% compared to 2018. Of the total number, about 93% were filed by domestic entities, a share that is comparable to that of 2018 (9.1%). These figures brought China to the top spot of PCT filers after the US had retained the title for 40 years, in particular since the PCT system was put in place in 1978.
As stated by Francis Gurry, Director General of the WIPO:
China’s rapid growth to become the top filer of international patent applications via WIPO underlines a long-term shift in the locus of innovation towards the East, with Asia-based applicants now accounting for more than half of all PCT applications.
What is maybe even more interesting is the speed at which the share of PCT applications from China has increased: from 276 in 1999 to 60,993 last year: a 200-fold growth in just 20 years.
3. The growth of trademark applications is slowing down, too
Last year’s amendments to the Trademark Law might have played a role.
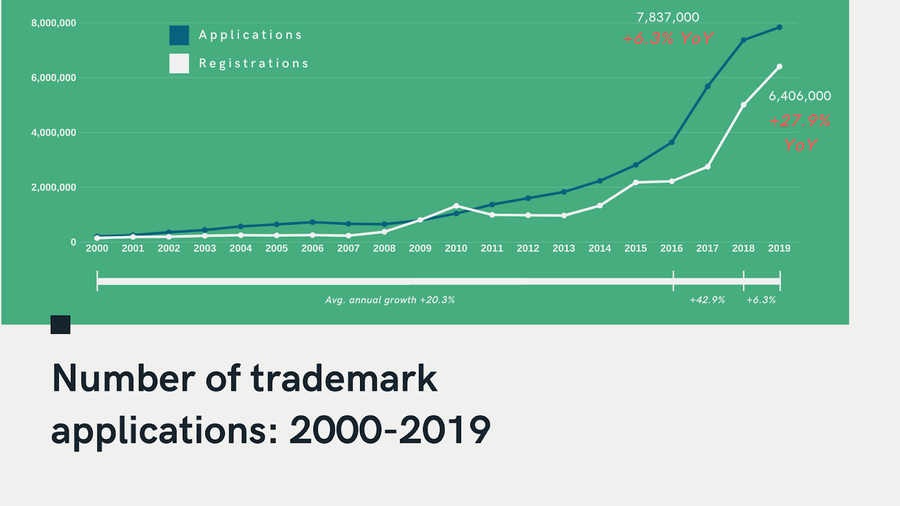
The total number of trademark applications filed in 2019 was about 7.83 million, of which 96.7% were filed by domestic applicants. The share is in line with what was seen the previous year. The overall annual growth rate between 2018 and 2019 was a mere 6.3%, which compared to 20.3% between 2000 and 2016 and 42.9% between 2016 and 2018 highlights a clear slowdown.
One possible explanation for fewer trademark applications has to do with the amendments to the Trademark Law approved by the Standing Committee of National People’s Congress on April 23, 2019. These modifications, by specifically targeting bad-faith trademark filings, try to solve the age-old problem of trademark infringement in the country, which for decades has made it difficult for foreign companies to protect their brand on Chinese soil.
It should be noted that the modifications came into force on November 1st, so almost at the end of the year. However, it is not excluded that the applications that were clearly being filed by trademark squatters already began being rejected as early as May. Uncertainties around how to navigate the updated regulation might have deterred new applicants as well.
4. The transaction market is steadily growing
Transfers involving invention patents and utility models accelerated their growth in the mid-2010s.
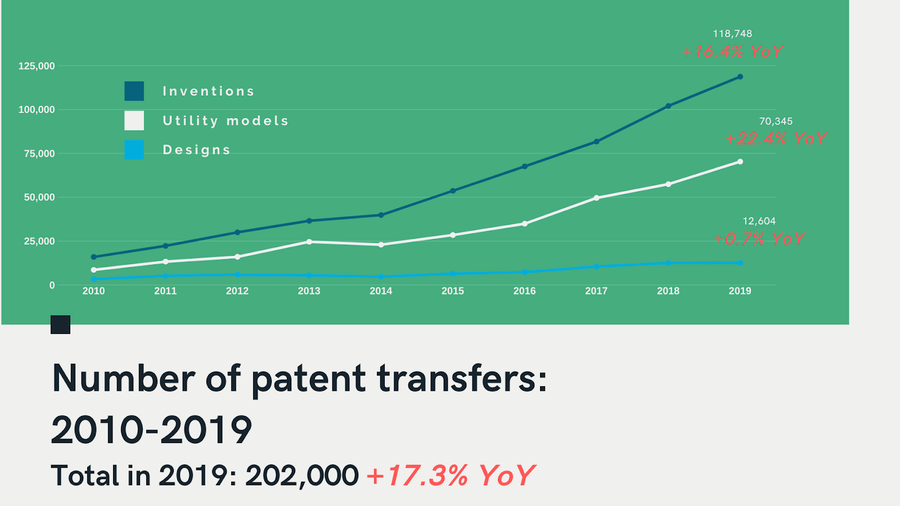
The number of patents transferred in 2019 was about 202,000. Of these, about 110,000 were invention patents and 70,000 were utility models, representing about 59% and 35% of the total respectively. By comparison, the number of patent transfers involving designs was relatively low, with a growth between 2018 and 2019 of just 0.7%.
One explanation of this lack of interest might be that design patents in China are not substantively examined. Applications for designs, in fact, are simply checked for their conformity to drawings and the description’s formal requirements: the examiners do not verify whether the proposed design is similar — or even entirely the same — to the prior art. The protection offered, thus, is quite limited.
5. Following the growth in filings, litigation activities are growing strongly
Civil disputes involving copyrights drove most growth.

Overall, there were 481,793 cases instituted in 2019, a 44.1% growth compared to 2018. Of these, 451,239 were instituted as civil disputes while 24,504 were instituted as administrative disputes, corresponding to 93.7% and 5.1% of the total respectively.
Among the civil disputes, cases involving copyrights made up the vast majority (73.4%), with trademark accounting for 16.3% of the total number. On the other hand, trademarks were at the center of most cases in administrative disputes, with a share of 89.6%. Trademarks made up the lion’s share in criminal disputes as well, accounting for 95% of the total.
It is worth mentioning that the high number of concluded cases doesn’t entirely refer to cases instituted in 2019: a relevant share of those come from previous years. This is particularly clear in the case of administrative disputes, for which the number of concluded cases (24,764) exceeds that of instituted ones (24,504).
Want more insights?
Fill out the form here to download the report and access the complete set of charts.