
Part II — How Machine Learning Gave Us a Better Approach at Patent Evaluation
Acquisition and Data Cleansing
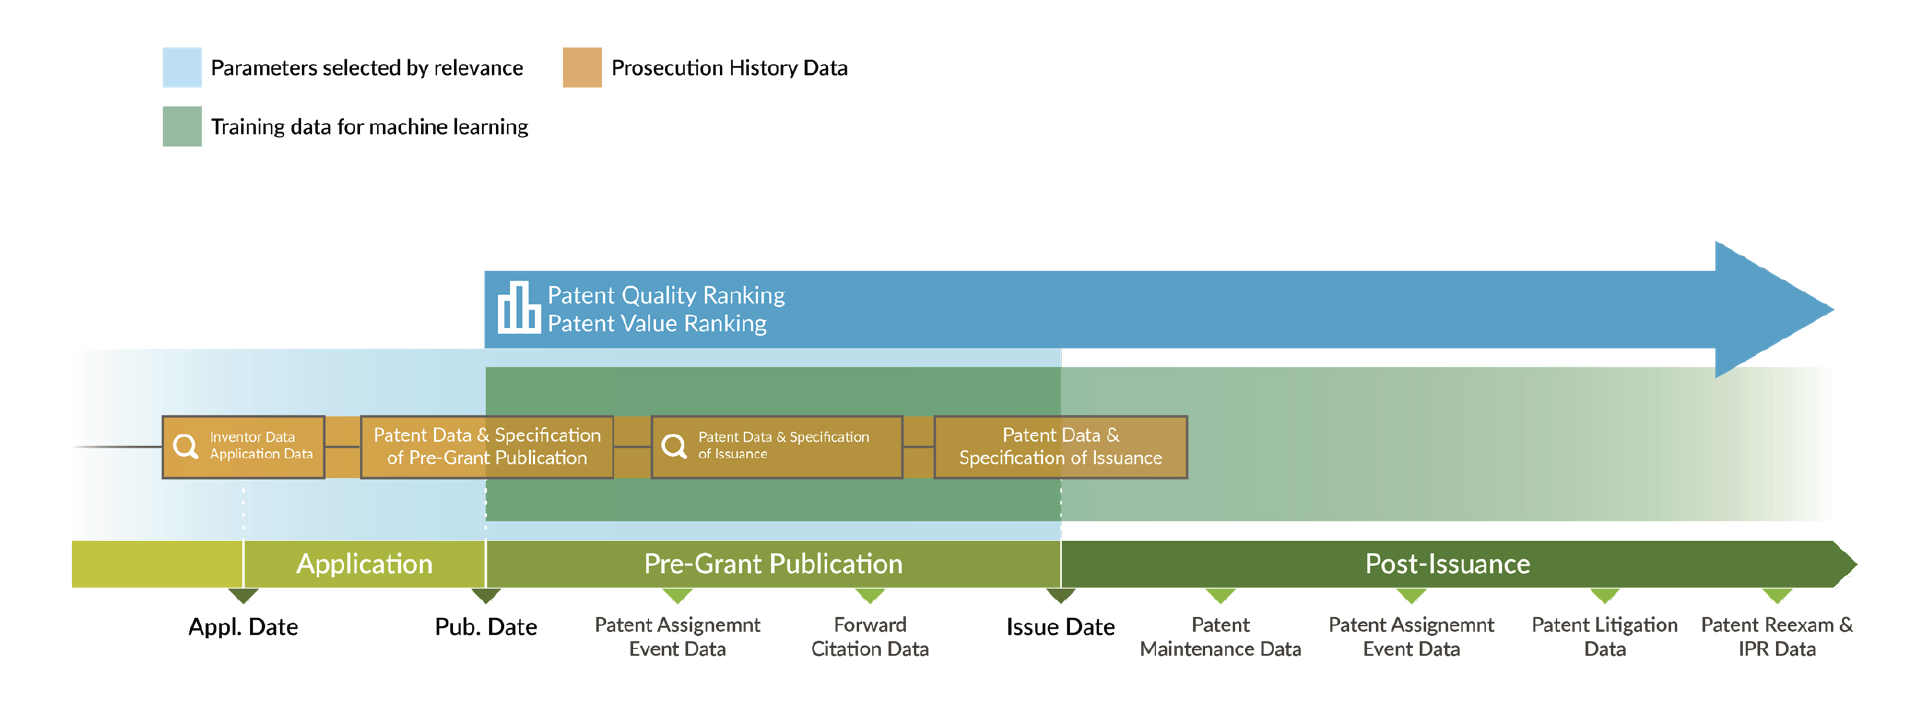
As illustrated below, the machine learning process behind Patentcloud’s Quality and Value Rankings begins with the acquisition of patent data from multiple sources such as bibliography, specification, and prosecution history.
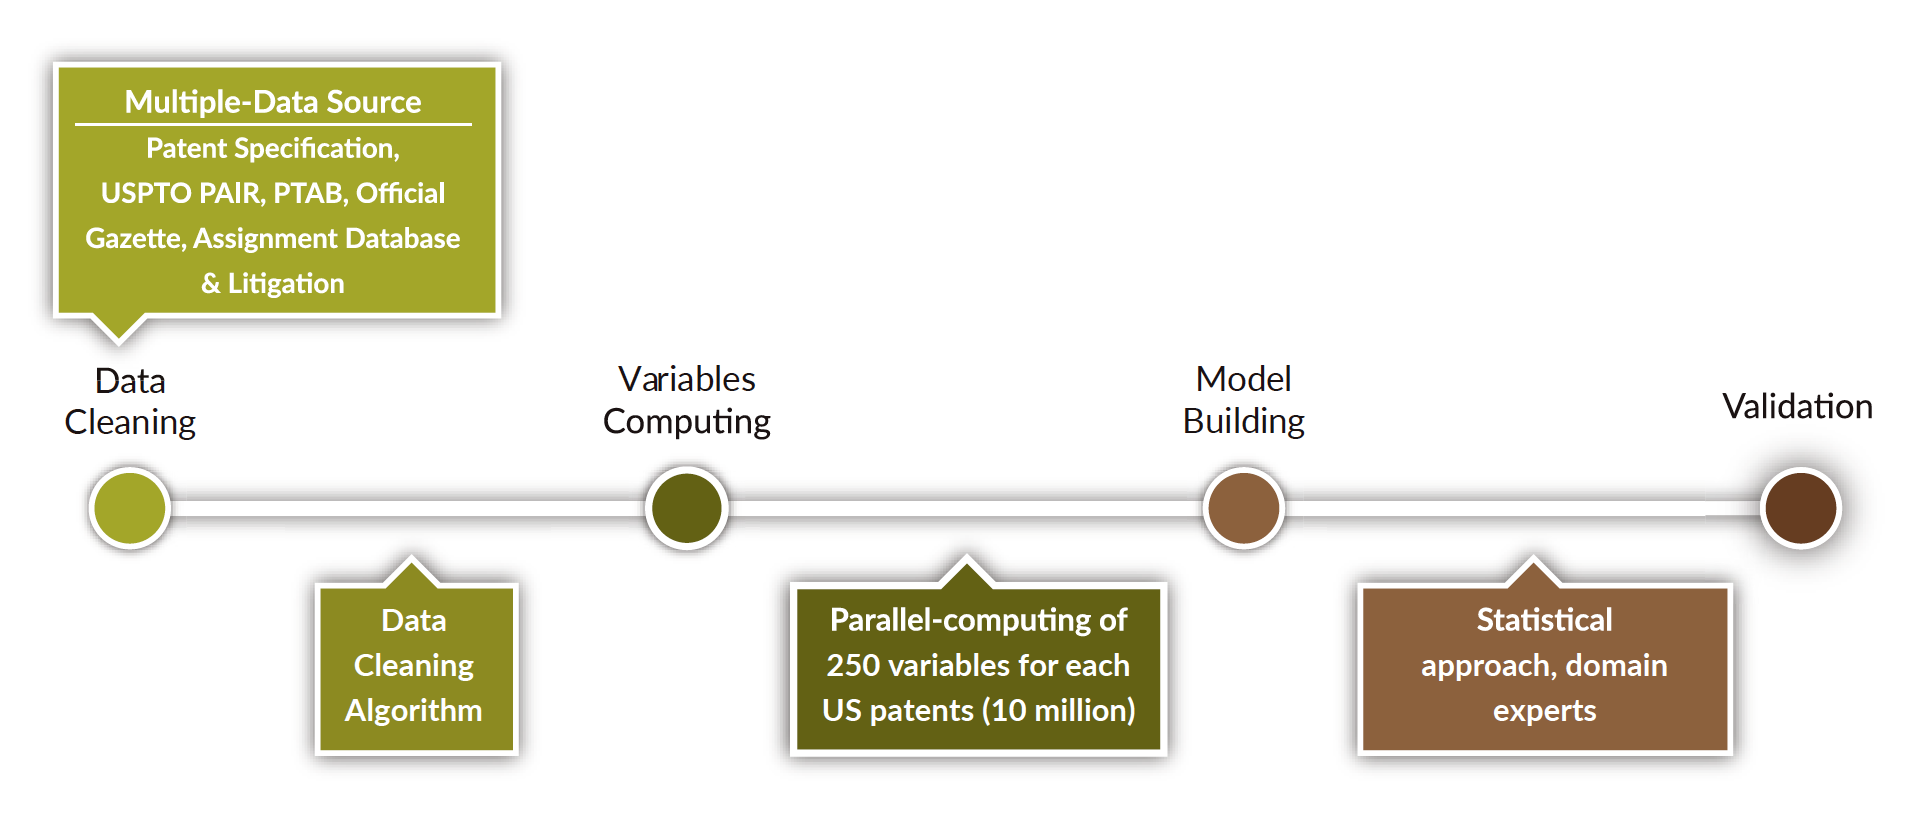
After dealing with any missing data or variation re-scaling issues through rigorous data cleansing, InQuartik’s data scientists worked with patent professionals to identify a set of 250 defining features.
These features mainly relate to the experience of the stakeholders (i.e., inventors, applicants, agents, and examiners), backward and forward citations, claim structure, prosecution history (i.e., rejections, amendments, change of attorneys) of patents.
Before being included in the set, however, each candidate variable had to be validated. Let’s take for example the variable “number of independent claims” and validate it against the litigated US patents.
A look at the actual data reveals that patents with a higher number of independent claims are more likely to get involved in patent infringement trials:
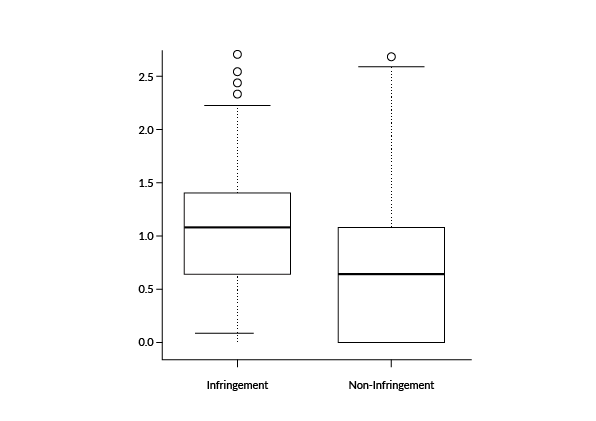
Therefore, since the Patent Value Ranking reflects the relative tendency of patents to be practiced or monetized after their issuance, this variable was selected as one of the features.
Variables Computing and Model Building
This step involves the statistical approach of the training material through the parallel computing of the variables.
The training material for the Patent Quality Ranking comprises patents requested for reexamination and Inter Partes Review (IPR), while the one for the Patent Value Ranking includes transacted, litigated, and forward-cited patents. In both cases, positive and negative label data is taken into consideration.
As an example, the positive label data for the Patent Value Ranking model includes 47,000 litigated, licensed, and requested for invalidation patents, as well as another 47,000 patents with a relatively higher frequency of transaction events or forward citations.
A similar number of patents that have never been litigated, licensed, transacted, requested for invalidation, or forward-cited is used as negative label data.
The label data for the Patent Quality Ranking model includes a similarly-sized pool of litigated patents: those requested for invalidation function as negative label data, the rest as positive label data.
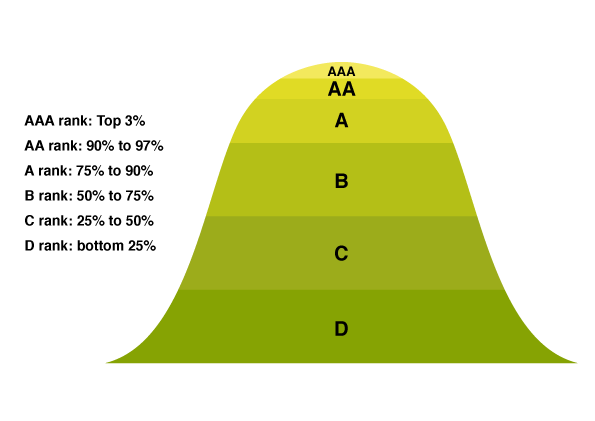
Since absolute scores (or their aggregation and/or difference) would be practically impossible to interpret, the next step is to assess the similarity of each patent with the high-quality or high-value models identified above and provide the resulting relative rankings:
Validation
Following the initial model building phase, InQuartik’s data scientists continued their collaboration with patent professionals to validate the results and optimize the models.
In particular, to continuously track the significance of the correlation between the models and the events they are trying to predict, the team built two monitoring systems: one for patent infringement cases to validate value, the other for USPTO PTAB cases to validate quality.
The monitoring system for the Patent Value Ranking tracks patents that are involved in litigation: since, according to our definition, these patents are deemed to have value because of their potential for being monetized, their Patent Value Ranking should be higher than those that have never been litigated.
As shown below, among the 4,867 litigated patents considered, more than 60% score higher than A:
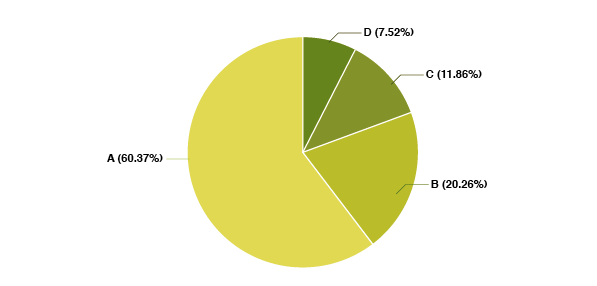
Below are the detailed figures:

Similarly, reexamination and IPR cases are tracked to verify the reliability of the Patent Quality Ranking. The results are comparable to the previous ones: among the 2,127 patents involved in IPR or reexamination cases considered, more than 60% score lower than C:
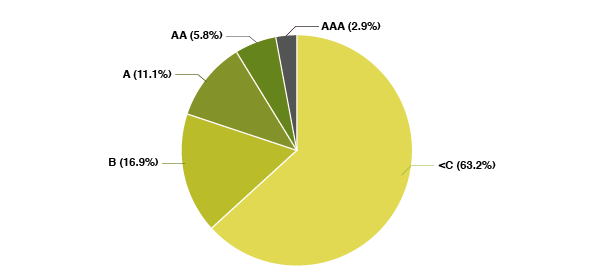
The detailed figures are found in the table below:

The Patent Value Ranking also validates against data related to patent commercialization, such as patent linkage data (FDA Orange Book), Standard Essential Patent (SEP) declarations (ETSI IPR database), and patent virtual marking data collected from several S&P 500 companies.
Large M&A deals, such as the Nortel deals, are selected as well as validation data. All the validations are performed on a portfolio (landscape) or entity basis.
The results conservatively reflect that:
For a patent portfolio or patents of an entity, the percentage of rankings above A and the percentage of rankings below C is significantly relevant to the monetization, commercialization, and invalidation events that the rankings are trying to predict.
For further details, please contact our Client Success experts.
Limitations
Patentcloud’s Quality and Value Rankings are an attempt at predicting the likelihood of future events involving patents. The rankings have both strengths and limitations.
Firstly, they should be leveraged exclusively within the correct context as their definitions may not always align with the various “literal meanings” of the terms “Patent Quality” and “Patent Value” in different scenarios.
For example, even though the Patent Value Ranking relates to the likelihood of patents being practiced or transacted, it does not take into consideration the market size of the products practicing a patent or the cost-effective enhancement of the products practicing a patent.
Additionally, a higher Patent Value Ranking doesn’t necessarily mean that a specific patent will be litigated or transacted: patents are rarely litigated or transacted at all.
The rankings, however, provide greater confidence when identifying patents that have been subject to litigation or transaction within massive portfolios.
As shown below, over 30% of the AA/AAA-ranked patents have been transacted after their issuance:
The details are found in the table below:
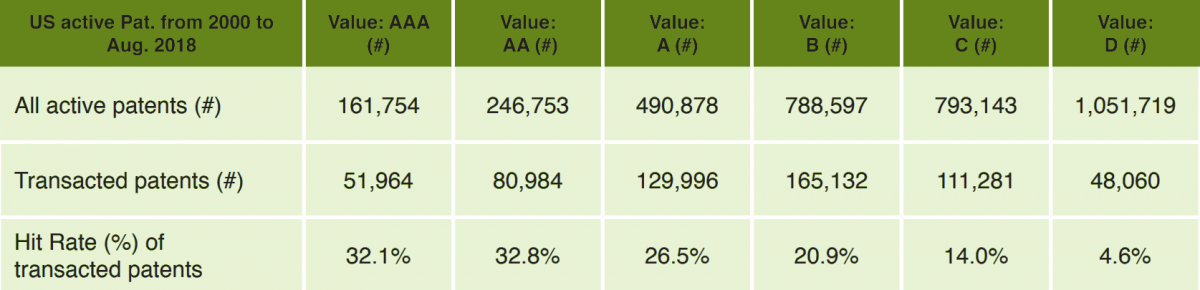
However, even though there is a significant difference (about six times) between the best and the worst quality patents, around 2/3 of the AA/AAA-ranked patents may never be involved in transactions or litigation.
It is clear that the higher the relevance between the definition of the rankings and the scenarios in which they are applied, the higher their effectiveness.
For contexts requiring different assumptions of “Patent Quality” and “Patent Value”, the rankings may still be applicable, but other relevant indicators should be considered and combined for better results.
Finally, it is mandatory to highlight that each ranking is determined based on all of the data available at the time of publication (or issuance) of the patent, meaning that all post-publication (or post-issuance) data is not taken into consideration for the generation of the ranking itself. Such information, however, may be included in training sets for newly published and issued patents.
To check out the other articles in the series, follow the links below:

Notes:
-
For example, among the 3,523,853 US patents issued and not abandoned from January 1st, 2000 to August 1st, 2018, only 64,516 (1.8%) have been involved in litigation and only 587,418 (16.7%) have been transacted.